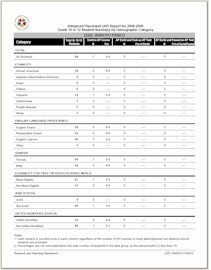
Each School report below provides data on Grade 10—12 students who were enrolled in an AP course, took an AP test, and passed an AP test. Results are disaggregated by ethnicity, English language proficiency, gender, eligibility for free or reduced-price meals, AVID status and gifted-identified status.
In order to read and print these documents, you will need Adobe Acrobat Reader on your computer. Click to download your free copy of Adobe Acrobat Reader.
2016 2015 2014 2013 2012 2011 2010 2009 2008 2007 2006 2005 2004 2003 2002 2001