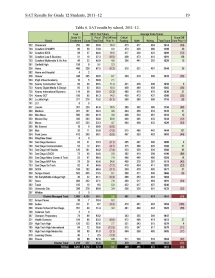
 Click for larger view of this sample page.
The SAT tests are taken by high school students around the world to meet undergraduate admission application requirements at colleges and universities in the United States. Most students take the SAT in their junior and senior years. The current district report summarizes SAT participation and performance of district graduates; older archived reports prior to 2013 summarize SAT data for all district 12th grade students who either graduated or left the district. SAT participation rates and average scores are disaggregated by selected student demographic and program attributes and by school.
The College Board will replace the current SAT with a redesigned version in March 2016. As such, SAT results for graduates in 2016 will include results from the current and redesigned SAT. The new SAT combines score reporting for critical reading and writing, thus reverting back to a composite scale score maximum of 1600—200 to 800 for Reading and Writing and 200 to 800 for Mathematics. The essay portion will be optional. (https://collegereadiness.collegeboard.org/sat/inside-the-test/compare-current-new-specifications)
See the College Board website for more details.
Select a report from one of the years below.
| 2014 | 2013 | 2012 | 2011 | 2010 | 2009 | 2008 | 2007 | 2006 | 2005 |