Multi-School Summaries
- English Language Arts and Mathematics
- Science
- History/Social Science
There are six different CST summary reports detailing CST results by demographic catetory, by testing strand, or performance level. These reports are available at the district or school level (and often by area, cluster, board area, district-managed, charter); some even compare CST results for a two- or five-year period. Below is a detailed explanation of the information provided in each summary report.
Multi-School Summaries
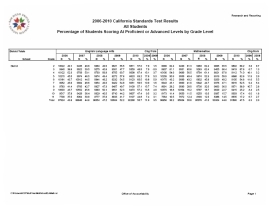
These five-year summary reports indicate the percentage of district students by school and grade level scoring at or above the proficient level
each year and the change over that five-year period. The reports detail results for all students, males, females, English-speaking students, English learners, economically
disadvantaged students, or non-economically disadvantaged students for:
|

|
|
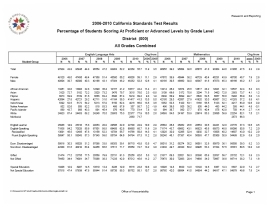
The reports display for each year in a five-year period the number of students tested and the percentage of those students who scored at or above the Proficient level on the selected CST subject area test, as well as the change in percent at or above proficient from the first year to the last year and from the previous year to the most recent year. Each page displays results for all students and for categories of students in each of eight dimensions:
|
The results are displayed in table form for either English language arts and mathematics, science (end-of-course and NCLB core), or history/social science, for the school, district, or other grouping as a whole and for each grade level.
|
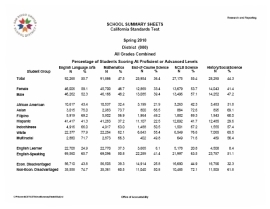
The reports, for the district as a whole, for individual schools, or for other groupings of schools, display the number of students tested with standard test administrations and the percentage of those students who scored at or above the Proficient level on required CST subject area tests. Results are displayed for all students and for categories of students in each of six dimensions:
|
|
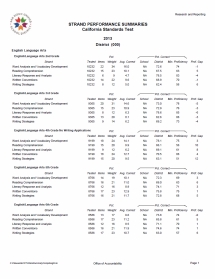 The reports, for the district as a whole and for individual schools, show how students performed on the individual strands of each California Standards Test; they indicate areas of
relative strength and weakness.
Strands represent groups of questions on the test addressing clusters of related state content and skill standards. For a good understanding of how students performed on these strands or content clusters, it is not sufficient to look at just the percentage correct to determine where students, for example, did best or worst. Questions on the standards tests vary in difficulty and some strands may be more difficult because of the specific questions asked or because of greater or lesser dependence on accumulated knowledge and skills. Therefore, it is important to take into account how students performed on a strand compared to the level deemed proficient.
However, strands do not have proficiency levels. The closest approximation to the minimum level required for proficiency on a strand is the average percentage correct on a strand scored by students statewide who scored at the minimal proficient level for the test as a whole. Students' performance on a strand can then be gauged by the "gap" between their performance on a strand and the minimally proficient students' performance on the same strand.
Therefore, for each strand, the summary displays:
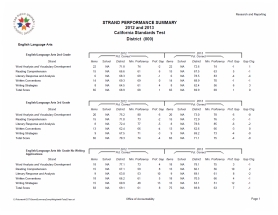 The reports, for the district as a whole and for individual schools, show how students performed in over the last two years on the individual strands of each California Standards Test;
they indicate areas of relative strength and weakness, as well as the change in performance over that period.
Strands represent groups of questions on the test addressing clusters of related state content and skill standards. For a good understanding of how students performed on these strands or content clusters, it is not sufficient to look at just the percentage correct to determine where students, for example, did best or worst. Questions on the standards tests vary in difficulty and some strands may be more difficult because of the specific questions asked or because of greater or lesser dependence on accumulated knowledge and skills. Therefore, it is important to take into account how students performed on a strand compared to the level deemed proficient.
However, strands do not have proficiency levels. The closest approximation to the minimum level required for proficiency on a strand is the average percentage correct on a strand scored by students statewide who scored at the minimal proficient level for the test as a whole. Students" performance on a strand can then be gauged by the "gap" between their performance on a strand and the minimally proficient students" performance on the same strand.
Therefore, for each strand--and for each test as a whole--the summary displays for each of the two years:
The results are displayed for all strands and schools for which there are results for at least ten students each year. Results for subjects tested in the most recent testing year or schools opened in that year can be viewed in the one-year strand performance summaries.
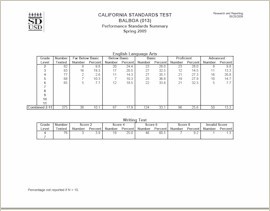 All students are expected to take a CST in English Language Arts corresponding to their grade level. In addition, students in Grades 4 and 7 are administered a California Writing Standards Test.
Students are given 60 minutes to write an essay in response to an assigned task. The types of writing used for the test vary from year-to-year and are based on California"s Writing Application
Content Standards. Beginning in 2006, student papers are scored by a reader using a 4-point scoring guide and the scores are multiplied by two. Since 2002, the writing test scores have been
incorporated into the overall English Language Arts scores for Grades 4 and 7.
These reports, for the district as a whole and for individual schools, display the results for the English Language Arts and Writing Standards Tests. For English Language Arts, the reports show by grade level the number of students tested and the numbers and percentages of those students who scored at each performance level: Advanced, Proficient, Basic, Below Basic, and Far Below Basic. Students scoring at Proficient or Advanced are considered to have met the state standards. For writing, the reports show for Grades 4 and 7 the number of students tested and the numbers and percentages of those students scoring in certain ranges.